
Long Stock Trade: TEL
January 21, 2014, 12:07 am
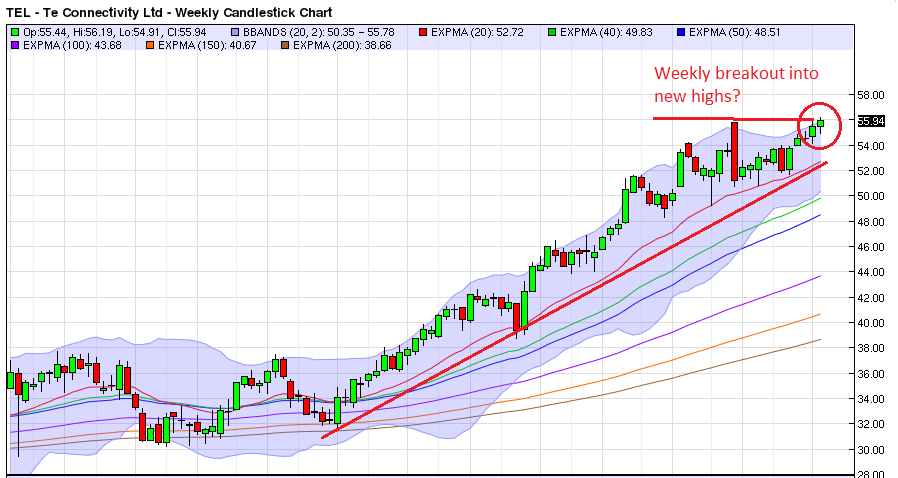
This stock, TEL, appears to signal a breakout to new highs on its weekly chart, above.
Why this trade looks good
Here is a stock trade setup that has lots of great technical and fundamental traits going for it.
First and foremost, the symbol TEL has been in an undeniably strong uptrend for the past year. The best trade setups are those that allow a trader to jump on board an established trend.
Moreover, as can be seen from the weekly chart, above, TEL appears to be signaling that it is going to break into fresh new highs, after which there is no previous resistance levels to hold it back.
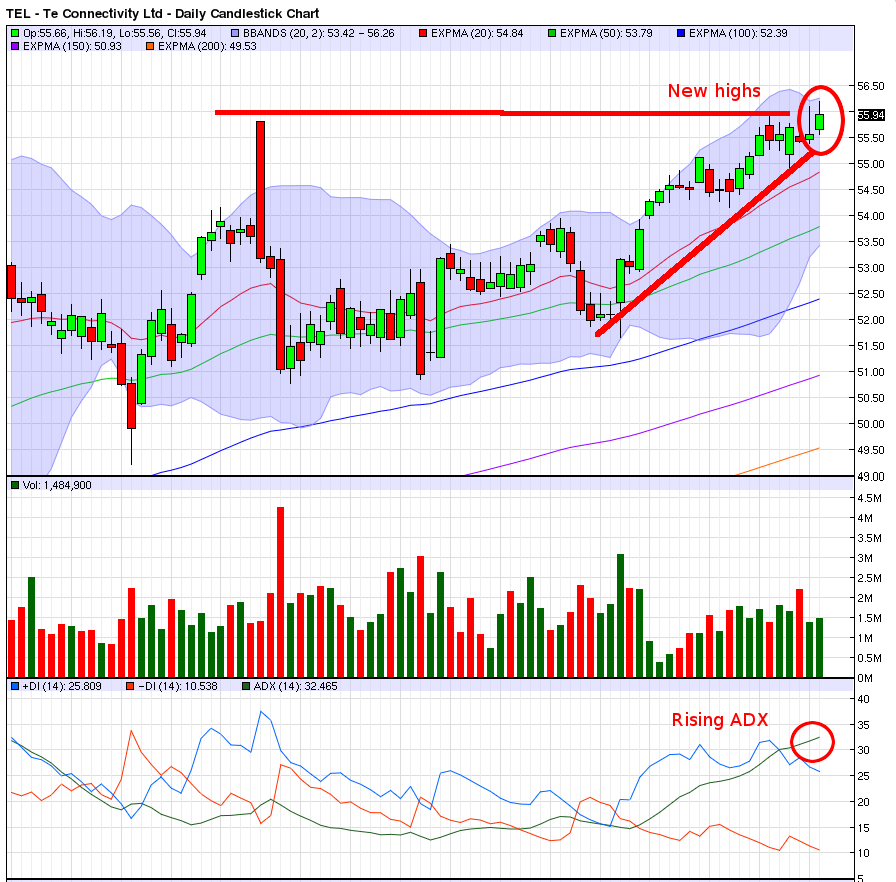
Another strong signal comes from the rising ADX reading on the daily chart. As explored in the Thirsty Finance lesson that discusses trend indicators, momentum precedes price, and so if the ADX is making new highs, new highs in price are to follow:
What can go wrong?
As is reiterated throughout the trading lessons, new traders must learn to consider carefully the scenario in which they're wrong. It's easy to get excited about the potential upside to a trade, and therefore focus on the money to be made, but even the best traders are only 50% correct in their picks. This means a trader must take seriously the opposite scenario.
A possible scenario in which this trade is wrong is possibly the stock is too stretched, and it must correct or consolidate sideways before moving higher. After all, when a trend is obvious for all to see -- especially one that has been on a tear for a long time like this one -- it is likely closer to its end than its beginning.
So, what's the trade?
Here is how this trade can be played:
Buy on a stop limit at $56.20. This means that the trader is buying strength as the stock makes new highs. After this happens, only two things can happen: the stock will go higher or it will go lower.
Place a stop loss at the low of the most recent range at $55.41. If the breakout is for real, the low of the range will go unchallenged. But if the breakout is a head-fake and the stock is going to shake-out everyone who has gotten long, the low of the range will be the first price point to fail. Never forget, the first loss is always the best loss.
Price target: $58 or when price goes parabolic.
This trade has a risk-reward ratio of 80 cents to $1.80, which means the potential reward is 2.25x greater than the risk. This is an excellent risk-reward ratio, because it means a trader can take setups like this and be wrong most of the time and still be profitable.
If this trade is triggered, stay tuned for a recap after it plays out.
Thirsty Finance Summary of Trades
| Symbol | Date Entered | Price | Target | Reward - Risk Ratio | Date Closed | Result |
| TEL | Jan 21, 2014 | $56.20 | $58 | 2.25 | Jan 22, 2014 | Target hit |
Comments
comments powered by Disqus