
Serious Weakness in the Great Bull Market
February 3, 2014, 1:25 pm
The incredible bull market rally since March 2009 shows significant signs of fatigue. Stock market participants should adopt an appropriately cautious, cash-heavy approach.
The trend is your friend...
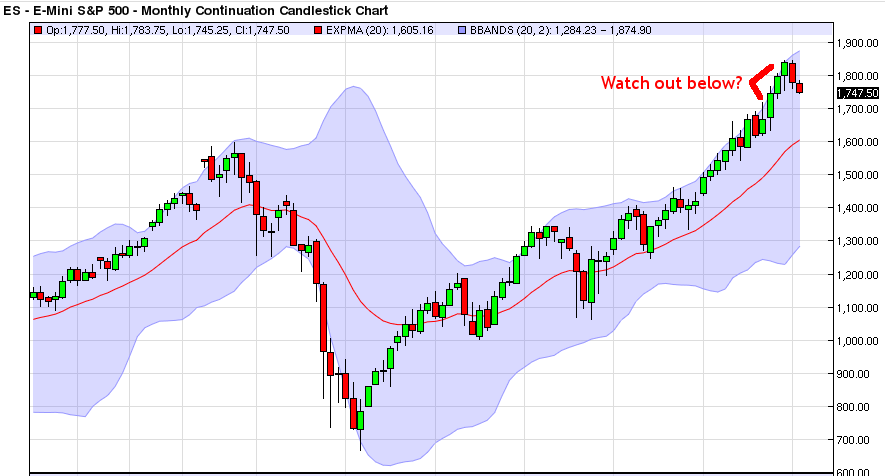
The stock market since March 2009 has been in a terrific bull run. In the above monthly chart of the S&P 500, it can be seen that long ago, last spring, the market already surpassed its all-time highs in the fall of 2007 following the easy-money boom of the sub-prime mortgage era. The V-shaped rally since the March 2009 lows has led the market to an astounding 275% rate of return, meaning that stock market bulls and passive investors have enjoyed a return of nearly 3x their money since the lows. As the Wall Street maxim goes, the trend is your friend, and for the better part of 5 years, it certainly has been.
...until it bends and breaks
But bull markets do not continue forever, and when the time comes that everyone just takes a bull market for granted, the bull run is near its end. This is because when there are no more buyers to prop up prices, by definition only sellers remain.
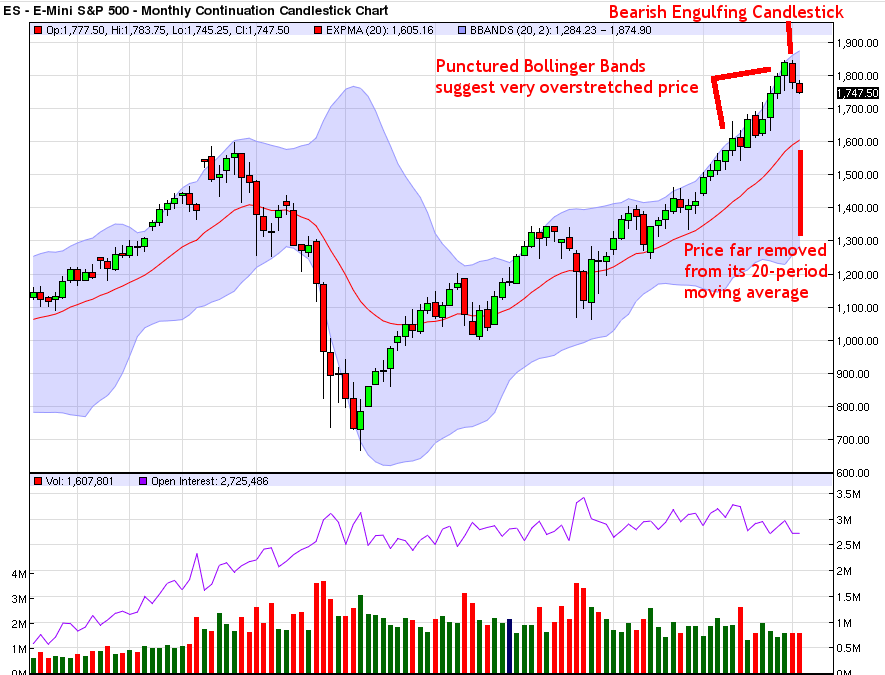
In the above monthly chart, there can be seen a few troubling indications that the stock market is in for a tough spell in the short term. They are:
- Prices have broken through the Bollinger Bands, which represent two standard deviations of price movement. Punctured Bollinger Bands on a monthly chart are a rare occurrence, and they have happened multiple times over the past several months. When this happens, expect price to revert back to the mean.
- There is a bearish engulfing candlestick from the all-time highs. See the trading lesson that discusses candlestick patterns for greater discussion on this ominous signal.
- Price is vastly overstretched from its 20 month period moving average. It has not touched this moving average in over 19 months -- meaning the time is high for it to finally do so.
- In the realm of fundamental analysis, the US Federal Reserve is in the midst of scaling back its historic Quantitative Easing program, which will take lots of liquidity out of the markets in the following months. Moreover, lots of fund managers chased the stock market higher to end 2013, and now there may be no more buyers left to support prices.
Technical damage on the weekly chart
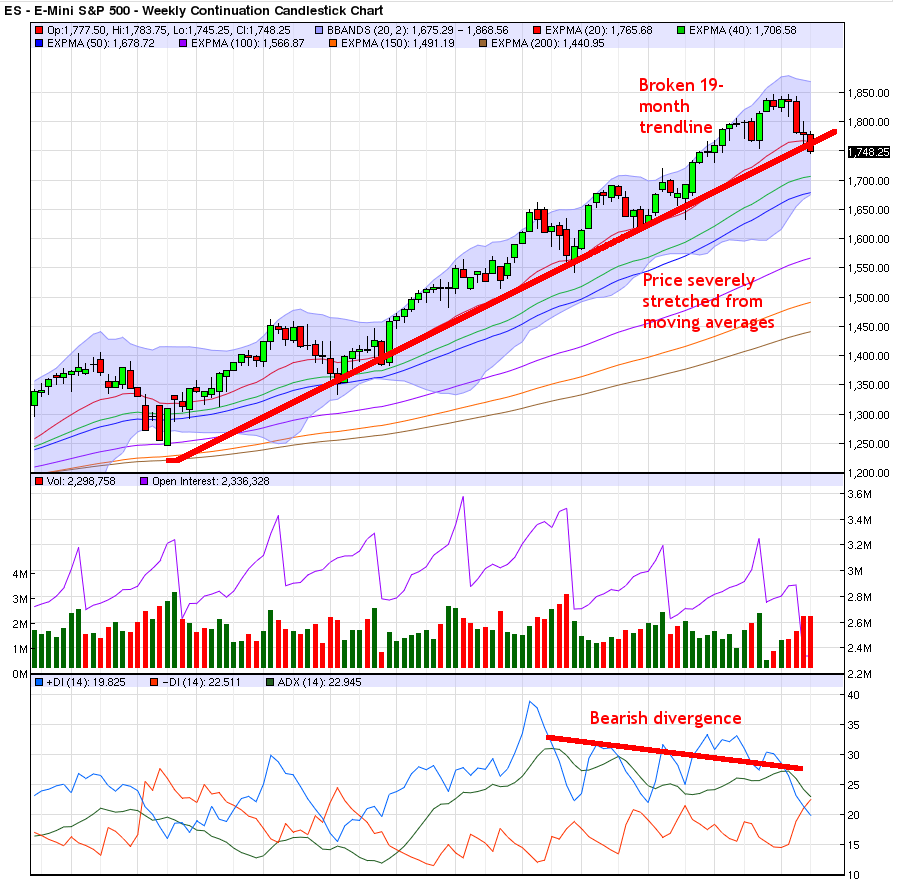
The fatigue in the bull market is also visible on the weekly S&P chart, below. Here are the issues visible on the weekly chart:
- A major trendline -- one reaching back to May 2012, over 19 months ago -- has been violated for the first time. As is discussed in the trading lesson that explores trends, a broken trendline is the first step in a trend reversal.
- The moving averages are very stretched, meaning that price has lots of ground to cover in the opposite direction until it reverts back to the mean. For example, it is sky-high from its 200 period weekly moving average.
- There is bearish divergence in the weekly Average Directional Index indicator, or ADX, reading. Bearish divergence means that price has made a new high, but the ADX indicator has not. This suggests the strength of the latest bull push is questionable. See the lesson that discusses indicators for trends for more info on the ADX and bearish and bullish divergences.
Last but not least, the daily chart
The damage observable in the monthly and weekly timeframes is loud and clear in the daily timeframe chart. In fact, where distant trouble is viewable on the higher time frames, on the daily timeframe, there already is blood in the streets, with significant technical damage to the bull market trendline.
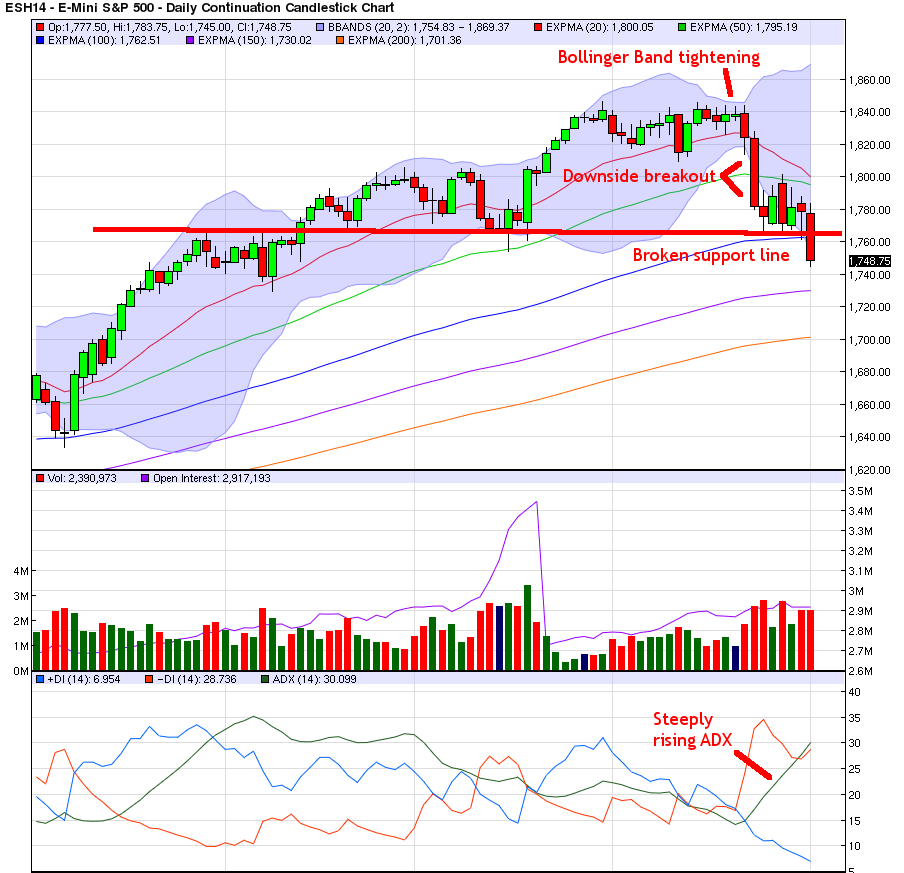
Here are the issues of concern with the daily timeframe:
- There was a tightening of the two-standard deviation Bollinger Bands at the highs. When this happens, price is getting ready to breakout either higher or lower. The unfortunate development is that the breakout was to the downside.
- The large breakout candlestick to the downside represents significant damage that the bulls will have to handily defeat to regain their momentum. This is a ginormous task this late in the bull run.
- Price has already taken out its previous line of support, and is barreling towards its 150 period moving average, seen in purple above. If the bulls lose 1740 on the S&P 500, watch out below.
- There is a steeply rising ADX, and as Thirsty Finance students know from the trading lessons, momentum precedes price.
So, where do we go from here?
The hallmark of a good trader is to patiently sit tight and anticipate what might happen next. If the market plays out as the trader anticipated, then there is a basis for making a trade. If not, the trader continues to comfortably sit on the sidelines and wait for a better opportunity.
In this market, in which bulls have been lulled into taking the multi-year uptrend for granted, there are a number of possible scenarios to prepare for. They are:
- There is no break in the selling and the panic crescendos to a climax. A 1987-style 'Black Monday' may be possible, where the entirety of the bull run is lost in a global meltdown overnight.
- Bulls stem the bleeding and sellers decide the sell-off has been sufficient for now. The market may rally and test its recent highs, or at least the highs of the hugely damaging red daily candlestick on Friday Jan 24.
- There may be a brief pause in the selling before the panic resumes. This scenario does not see a robust rally back to test the previous highs, but a garden-variety bear flag, which sees selling shortly resuming.
In theory there may be a chance the market will regain its footing and continue another leg of the bull market, but the damage has been so significant and the price is so overstretched that this is not a bet worth making.
In a correction like this, a trader may either do one of two things: sit tight in 100% cash and decide to do nothing, or sit tight in 100% cash and wait for a signal to short the market. In either case, once the correction or market crash has taken place, the trader's greed gland will perk up looking for entries to get long strong stocks.
Critical market turning points like this are when the Wall Street maxim 'Cash is King' is most applicable. Be careful out there.
Comments
comments powered by Disqus