
Ominous Overtones in the Stock Market
April 7, 2014, 2:14 pm

Following a remarkable V-shaped recovery from the March 2009 lows, the S&P 500's 5-year long bull run is showing signs of exuberance.
What's at stake in the stock market
As the above 25-year chart of the S&P 500 shows, the US stock market has been in an incredible bull run since its March 2009 lows from the '08 financial crisis. In fact, over the past couple years, the uptrend has actually gone parabolic -- which means its trendline has become increasingly steep.
This chart also shows that following each bull run over the last 25 years, there has been a painful and sustained period of reckoning for those who rode the subsequent downtrend. As iconic stock trader Jesse Livermore was always quick to point out:
"There is nothing new in Wall Street. There can't be because speculation is as old as the hills."
Translation: the subsequent downtrend is a matter of 'when,' not a matter of 'if.' And the steeper price action gets, the bloodier the impending correction will be.
When Warren Buffett is the chump
It's a common characteristic of late-stage bull runs that mainstream media jumps upon the excitement of the stock market's uptrend. When this happens, late-coming journalists publish media to be consumed by late-coming investors. For a case in point, consider this now-classic June 2005 Time magazine cover, published precisely at the peak of US home prices:

Time magazine cover June 2005, at the peak of US housing prices
This weekend came another ominously naive piece of financial writing, this time from a New York Times writer. While the editors are careful to couch the article in the safe territory of the virtues of index-fund investing, the title says it all:
The Oracle of Omaha, Lately Looking a Bit Ordinary
The article discusses how Buffett's Berkshire Hathaway has returned less than the S&P 500 over the past 4 years. And so, goes the logic, the stock market investor with the greatest record over the course of six decades has lost his touch and is now "ordinary." In other words, goes the implication, this time is different.
The fallacy -- and implicit danger of complacency -- found in conclusions like this is that for over 60 years, everytime the market has become exuberant and Buffett has underperformed, Buffett always stood aside in cash-heavy positions, and waited to swoop in once valuations crashed back to earth. For example, Buffett writes in Berkshire Hathaway's 2013 Shareholder Letter:
"Berkshire's book value and intrinsic value will outperform the S&P in years when the market is down or moderately up. We expect to fall short, though, in years when the market is strong - as we did in 2013. We have underperformed in ten of our 49 years, with all but one of our shortfalls occurring when the S&P gain exceeded 15%."
So, for Warren Buffett to again take his place as the best investor in the market, all that needs to happen is a reversal in the stock market cycle. For Buffett to continue to look "ordinary," the stock market must march upwards towards infinity. A rational person might doubt the potential of the latter.
Dangerous Signs of Distribution in the Stock Market
In stock market parlance, the term "distribution" refers to when institutions (the big money in the market) decides they have had enough and want out. And so they "distribute" their assets to other buyers in the market. Who they sell their shares to are smaller players ("weaker hands") who have been lulled into complacency and see nothing but a continuation of the past ahead.
In this daily chart from the S&P 500, one can see the violent red reversal candlestick that took place on the close of last Friday. This candlestick is particularly ominous because it comes on a day in which the market made a new high. If the market was stable and the uptrend was healthy, there would not have been such a violent reversal from the highs.
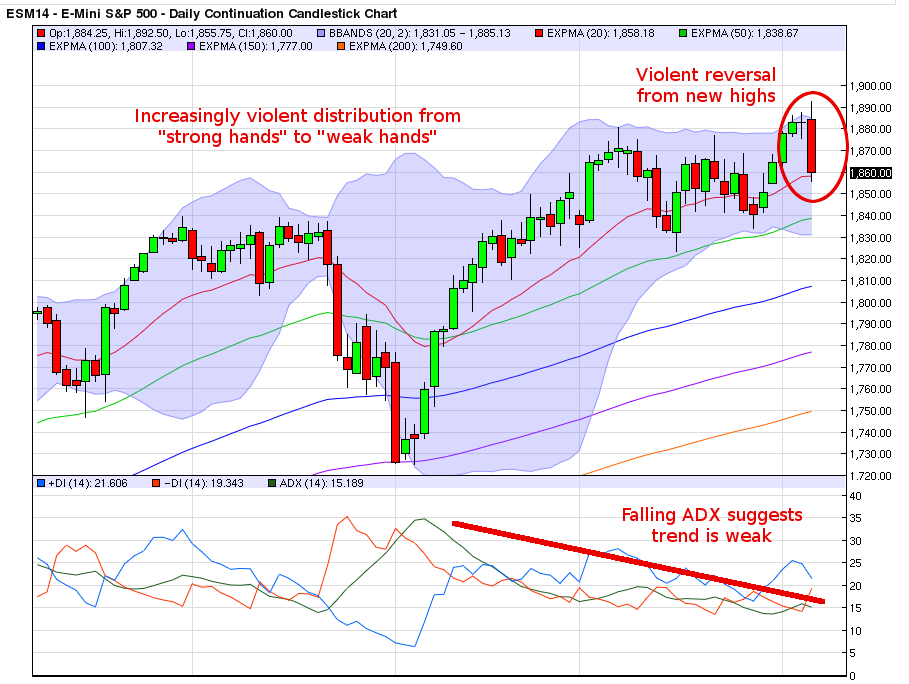
In addition to the reversal from intra-day all-time highs, above can also be seen the laggard ADX reading, which suggests the trend is weak. In contrast, a strong trend is marked by the presence of a robustly rising ADX reading.
To learn more about the ADX technical indicator, check out the Thirsty Finance lesson that explores it in detail:
Trading Lessons - Indicators for trends
So we do we go from here?
Sophisticated traders and market observers look at the stock market from the perspective of all possible outcomes, with each possible outcome continually being evaluated and given different likelihoods of materializing.
Here are some possible outcomes for the present market:
- The market may thrust higher, in which it goes parabolic and the market climaxes in a spike
- The market may range for a period of time, lulling everyone into complacency, and then continue higher
- The market may range for a period of time, lulling everyone into complacency, and then fall
- The market may fall in the near term
Any one of the above possible outcomes may play out in the near term. But in each case, complacency is the real danger. For illustration, consider the infamous quote from Yale University economist Irving Fisher in 1929:
"Stock prices have reached what looks like a permanently high plateau."
Lulled into complacency by the strength of that decade's bull market, Fisher lost his fortune when the crash happened.
Like in Fisher's time, uptrends have beginnings and ends, and the higher they go, the more explosive the potential fall.
Learn more about this
To learn more about these topics, check out their respective discussions in the following Thirsty Finance lessons:
Comments
comments powered by Disqus