
Taking stock of the 4 major market indices
May 19, 2014, 7:06 pm

The weekly chart of the Russell 2000 index, above, shows a serious violation of an 18-month bull market uptrend.
The 4 major stock market indices
There are over 8,600 publicly traded companies listed on US stock exchanges, which are reduced to 4 major averages that are most commonly used to analyze the stock market. They are:
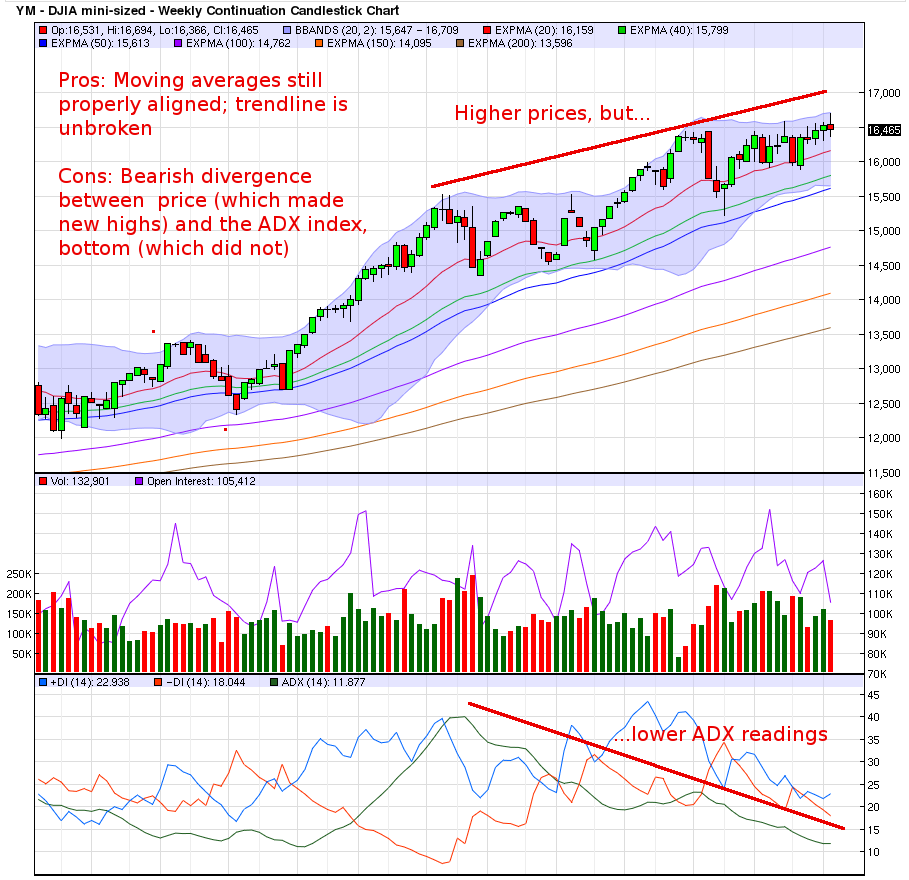
Dow Jones Industrial Average
The original stock market average, the Dow is composed of 30 stocks -- a tiny fraction of the 8,600 total listed in the US. Charles Dow is credited with the creation of this index in 1885.
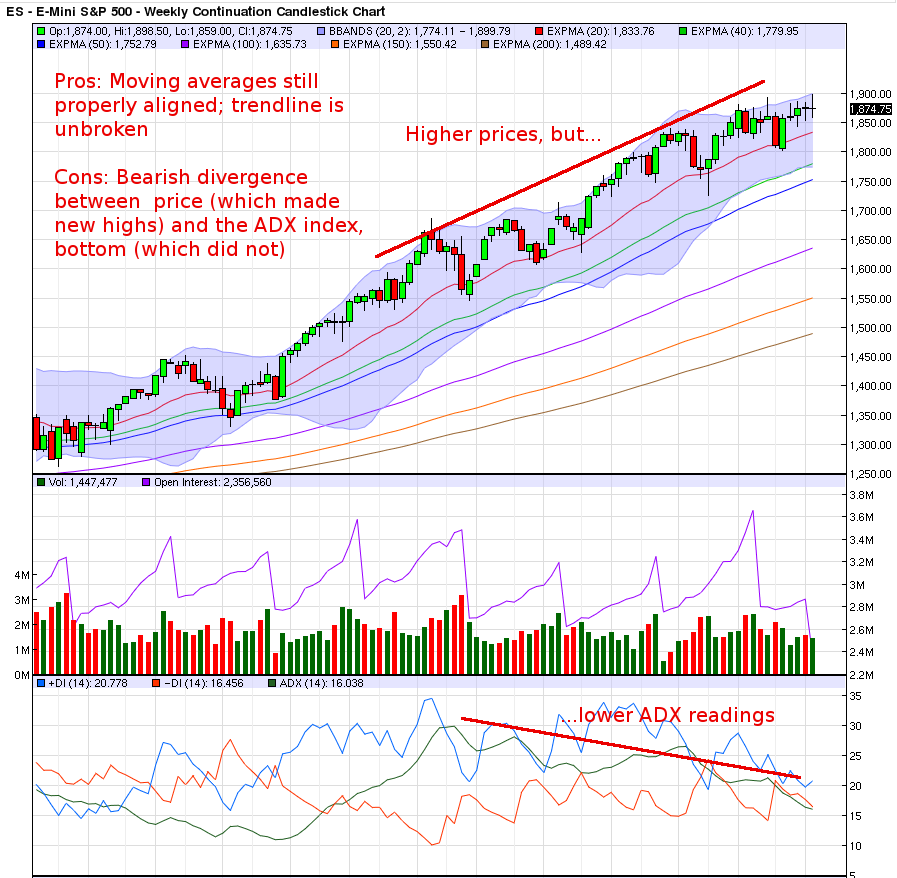
S&P 500
The S&P is an average of the stock prices of 500 large-cap US-listed companies. Since it makes use of many more stocks, investors typically use this index to refer to the stock market as a whole.
Nasdaq 100
Often simply called "the Nasdaq", the Nasdaq 100 is an average of the 100 largest non-financial companies that trade on the Nasdaq exchange. This index is associated with tech companies.
Russell 2000
The least commonly-known of the four indices, the Russell 2000 index tracks the performance of 2000 small-cap stocks in the US, and so represents the investment community consensus on the state of US small-cap companies.
The Dow, the strongest index
As can be seen from the charts below, the 30 stocks that compose the Dow are holding up the best among the other major indices. However, there is reason for concern beneath the surface. As can be seen, price has been making new highs, the ADX indicator, which measure the strength of a trend, has been making lower lows. This bearish divergence suggests that the uptrend is very weak.
S&P 500, the second strongest index
Following the select 30-company average that is the Dow, the S&P 500 represents a greater swath of large-cap US stocks. Its weekly chart resembles the Dow weekly chart, above, with properly aligned moving averages. Like the Dow, the S&P 500 shows bearish divergence between price and the ADX, which measures price momentum.
Nasdaq 100, the second weakest index
While the Dow and S&P 500 indices still show a trend that floats nicely above perfectly aligned moving averages, the Nasdaq 100 index shows greater weakness. As can be seen below, price has already been riding on its 20-period moving average and appears on the cusp of falling beneath it, which is the first step in grinding all the other moving averages.
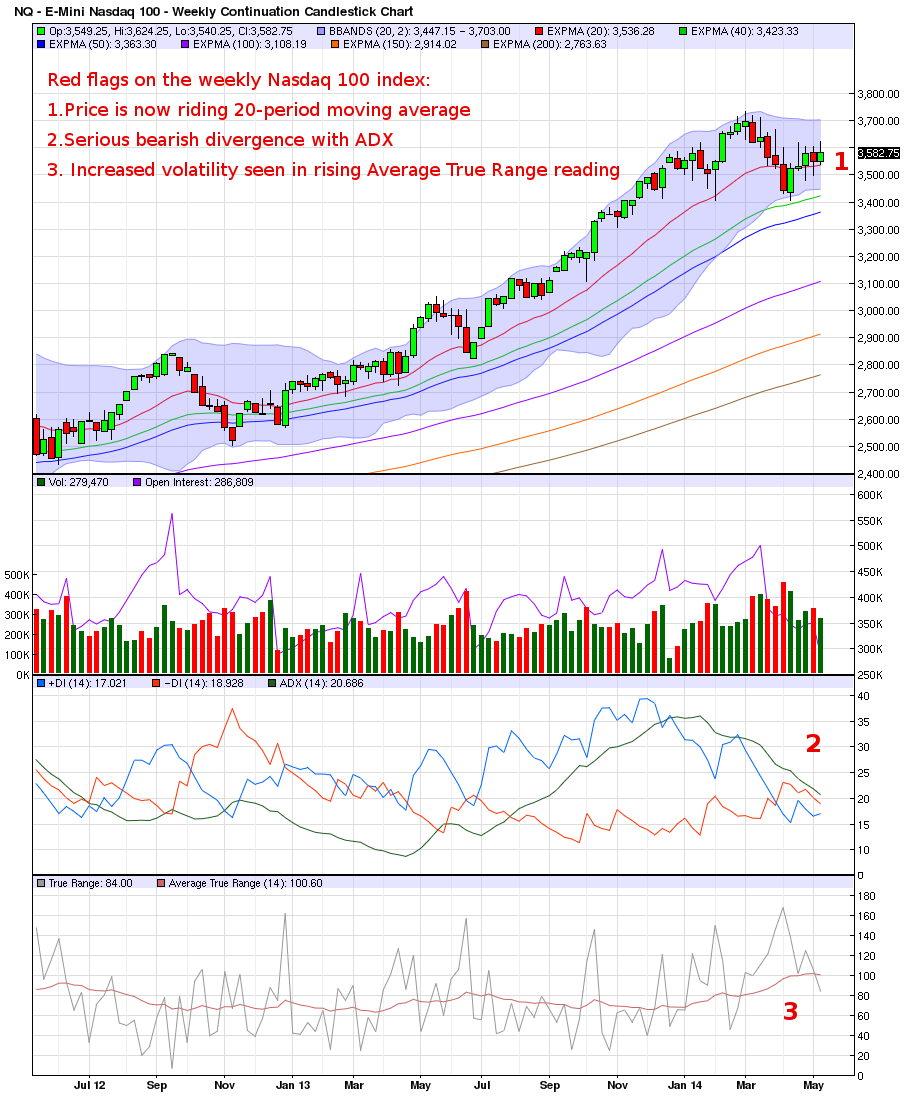
Also of concern on this chart is bearish divergence between the price and ADX momentum indicator, same as Dow and S&P. Lastly, the average price range of each trading period is increasing, which means price is become more volatile, which is indication of institutions who see a market top and want to unload their positions.
Russell 2000, the weakest index
The weakest of the four indices are the small-caps, which occupy the side of the investing spectrum opposite large-caps. As can be seen in the weekly Russell 2000 index chart, below, there is cause for concern of a correction in the short-term.
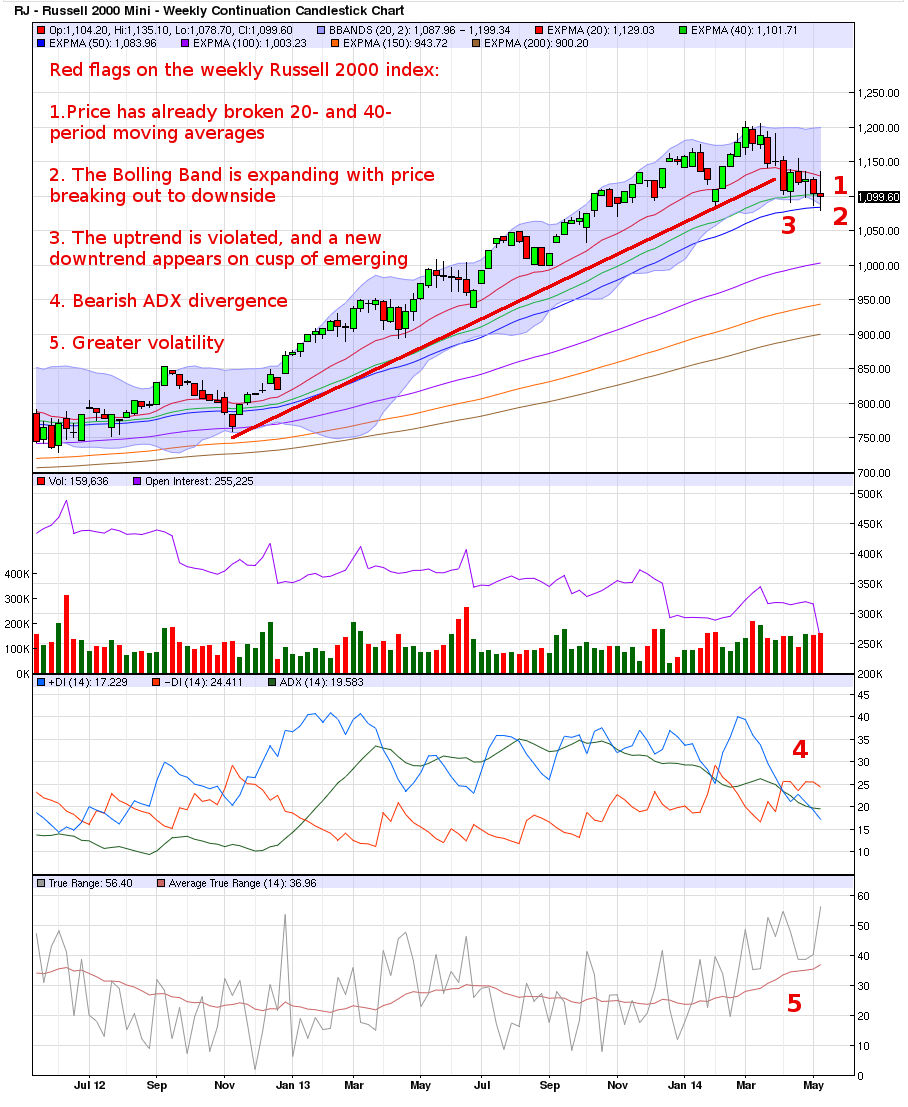
First, to a greater extent than the Nasdaq 100, the Russell 2000 has already broken its 20- and 40-period moving averages, and is flirting with the 50-period moving average. Second, accompanying the sloppy price action are expanding Bolling Bands to the downside. Third, there is a violation of an 18-month trendline, and price is dangling on the precipice of a correction or new downtrend. Fourth, like the other indices, there is bearish ADX divergence; and fifth, as seen on the Average True Range indicator, price is experiencing significantly greater volatility, which indicates strong hands want to eliminate their exposure.
Where to Learn More
Want to learn more about trading and investing analysis like this? Be sure to check out the Thirsty Finance lessons below that discuss these analysis techniques in detail:
Comments
comments powered by Disqus