
Brace for Panic in the Stock Market
October 11, 2014, 2:59 pm
There are alarming technical conditions aligning in the stock market that suggest investors may soon stampede to the exits. Above, a violent reversal.
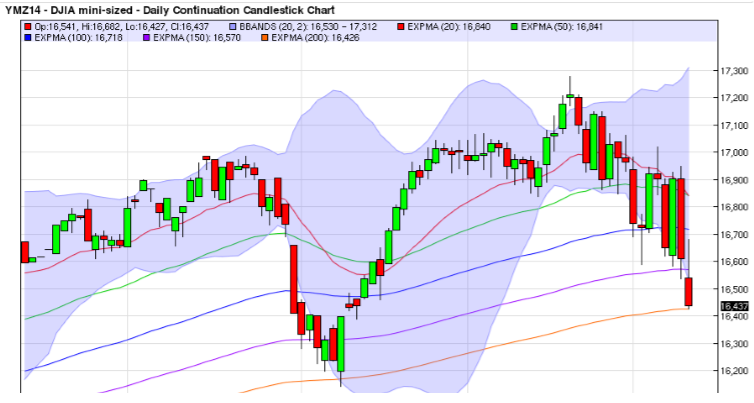
Daily Chart of the Dow
The stock market the past several weeks has demonstrated signs of distribution, in which strong hands with deep pockets (eg, institutions and funds) sell their positions to the market's weak hands, which are generally retail or less sophisticated investors. Violent weakness is readily visible in the above daily chart of the Dow Jones, which has lately been the strongest of the 4 major stock indices. The other 3 major indices are the S&P 500, Nasdaq 100 and Russell 2000.
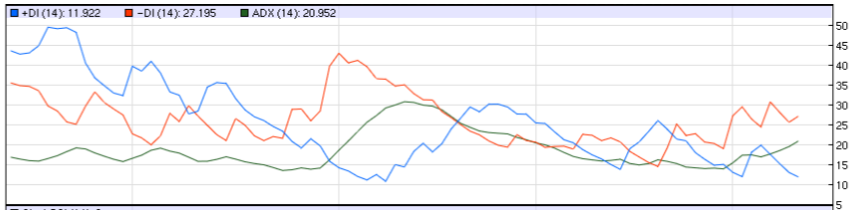
Moveover, here is the Average Directional Index technical indicator for the same above chart. The ADX, as is discussed in this Thirsty Finance trading lesson, measures the strength or weakness of a trend. The higher the ADX reading, the stronger the trend. A rising ADX reading is a strong signal the market's present direction is getting stronger, and it has presently crossed 20 and is rising. It's also noteworthy the recent grinding highs of the market did not budge the ADX, which suggest bulls are weak.
Weekly Chart of the Dow
The below weekly chart of the Dow, on the surface, looks like its uptrend may still be intact. However, beneath the surface, the astute observer will note the Dow is presently making yet another violent retreat to its 40-week moving average (200 day), and has this time sliced right through its 20-week moving average (100 day).
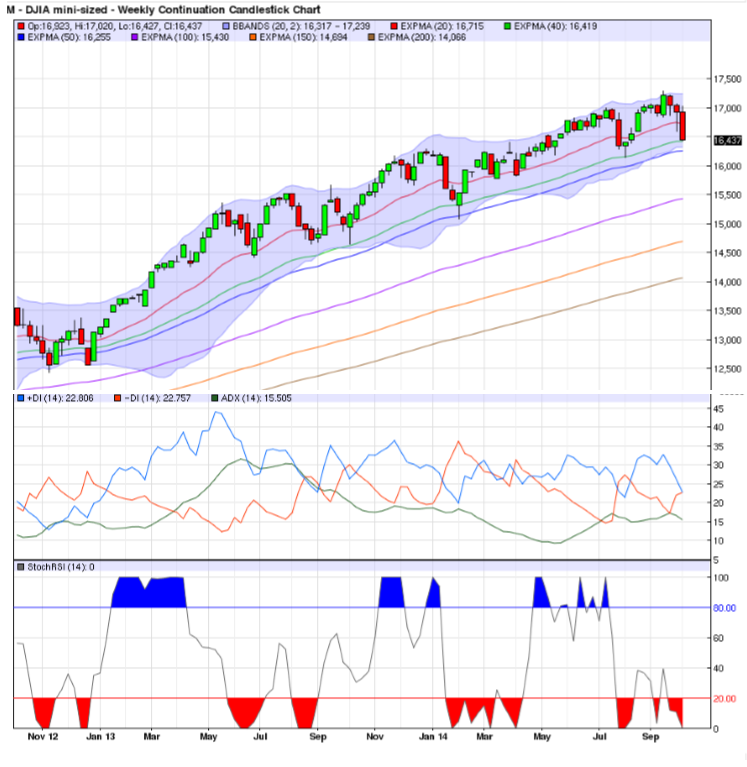
Also troubling on the above weekly chart of the Dow is the fact the market for the entire 2 year period shown has not once touched its 100-week moving average. This will not be true forever, and a retrace back down to the 100-week moving average will take the Dow down 1000 points to 15500. The real downside target, though, is the 200-week moving average presently at about 14000, which would represent a correction of 3300 points, or about 20%.
Furthermore, textbook Bearish Divergence is readily visible on the ADX technical indicator -- and bearish divergence of this magnitude suggests tremendous potential for a serious correction. Stock market sell-offs are always factually inevitable, and technical analysis suggests the timing of the next one may be sooner than later.
Where to Learn More
Want to learn more about trading and investing analysis like this? Be sure to check out the Thirsty Finance lessons below that discuss these analysis techniques in detail:
Comments
comments powered by Disqus